
Utility AI-Powered Customer Sustainability and Energy Cost/Emissions Benchmarking Widgets
The apps apply an AI k-nearest neighbor (KNN) analysis along with regression refinements where dwelling units or businesses from master databases are identified as belonging in the user�s �neighborhood� with a weighted distance measure that includes household/dwelling unit or business characteristics. Energy use and emissions from the nearest neighbors provide the basis for estimating the App user�s energy use and emissions. The master database includes energy use and emissions for more than 7 million households and businesses across the US. Utility Customer Cost Benchmarking Widget Details are described in more detail below: |
||

|
Utility Customer Benchmarking Analytics |
|
|
MAISY Energy Benchmarking Widgets provide cost and carbon emission comparisons for individual utility customers based on energy use analysis of the more than 7 million US individual commercial and residential utility customer records in the MAISY Energy Use and Hourly Loads Databases.
The analytical process includes the following steps:
|
||

|
Boost Utility Customer Satisfaction |
|
Utility Customer Cost Benchmarking Widgets bolster customer satisfaction by providing three resources that utility customers
consistently rank as important:
|
||

|
Accuracy and Cost Advantages of the MAISY Energy App Widget |
|
|
A variety of approaches have been used over the last decade to inform utility customers of their electricity use, typically with a monthly comparison. Several resource are available that purport to show individual utility customers energy use relative to similar customers. The problem with all of these options is that they do not accurately reflect �similar customers.� For example the EPA provides a residential energy use comparison ool (https://www.energystar.gov/index.cfm?fuseaction=home_energy_yardstick.showgetstarted ) that is incredibly inaccurate. The tool uses detail on ZIP code; dwelling unit square footage, number of occupants, and the last 12 months of utility. The EPA tool converts energy use to a source BTU basis that exaggerates the impact of electricity use (by counting production, transmission and distribution losses) so that an all-electric home always uses more BTU�s than an identical home with natural gas space heating, water heating, etc. The source BTU comparison plus the fact that comparions are not accurate if electric uses such as pool pumps, heat pump versus resistance heating, etc are ignored. Several firms have partnered primarily with large utilities to provide customer comparisons that incorporates customer list data from commercial list sources such as square feet, age of dwelling unit, number of occupants. These applications also fall short in accuracy because much of the customer list data is estimated, not actual (e.g., number of occupants) while important contributors to electricity use such as space heating fuel, presence of a pool or spa, water heating fuel and other items are not available from customer list sources. MAISY Utility Customer Cost Benchmarking Widgets provide the most accurate and most relevant electricity cost benchmarking available because
MAISY Utility Customer Cost Benchmarking Widgets also provide the most cost effective customer benchmarking by relying on the MAISY Residential Energy Use Database and a low cost SAS pricing model. |
||
|
|
Extended Utility Customer Benchmarking |
|
|
The MAISY Energy Benchmarking Widget is designed to operate independently of your utility's customer information.
The benchmarking process uses each visitor's information on their electricity cost
and dwelling unit, occupant and appliance characteristics to compare their cost to
a range of similar customers in the MAISY Utility Customer Database in that ZIP code.
Typical electricity use profiles for
various end uses such as space heating, air conditioning, water heating and so on are used to identify savings opportunities.
for each end use. These savings data are used to suggest typical savings associated with various energy savings
measures. An extended Widget option applies a summary subset of your utility billing data to automatically incorporate a user's electricity cost by entering an account number. The billing data is also used in the Widget software to develop a statistical estimate of customer space heating, air conditioning and non-weather sensitive electricity use as a basis for suggested energy savings options. This extension can be applied at any time after implementing the standard Widget process. Billing data items for each customer include account number, and electric bill, kWh use, and billing date for each of the last 12 months (these limited data items protect your customer's confidential information as the only identifying characteristics is an account number.) |
||

|
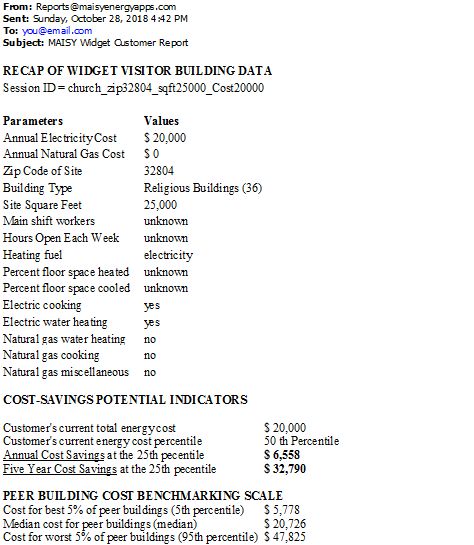
Receive Unique Real-Time Email Reports for Each Widget Participant | |
|
Each time a visitor engages the Sales Widget, you will be sent an email notification. Visitors can also opt into
providing providing
analytics for that Web visitor. Use this information to
evaluate the extent to which your Web visitors are engaging and their characteristics to
improve your customer outreach programs.
|
||
|
|
Copyright 2023, Jackson Associates, All Rights Reserved. Graphics Acknowledgements: Cityscape: Designed by Evening_tao |